Integration of Loxone/ioBroker/InfluxDB/Grafana
In anything but the smallest installations Loxone statistics are sadly lacking in a number of areas. Luckily there exist many third party applications that can be used to view both long and short term statistics... if only the data could easily be harvested from Loxone. This howto describes setup of one such solution using the following components:
- InfluxDB - a time series database.
- Grafana - an open source analytics and monitoring solution which will read statistical data from InfluxDB.
- ioBroker - an IoT platform designed for orchestrating data between home automation systems which can be used to pull values from Loxone and insert into InfluxDB.
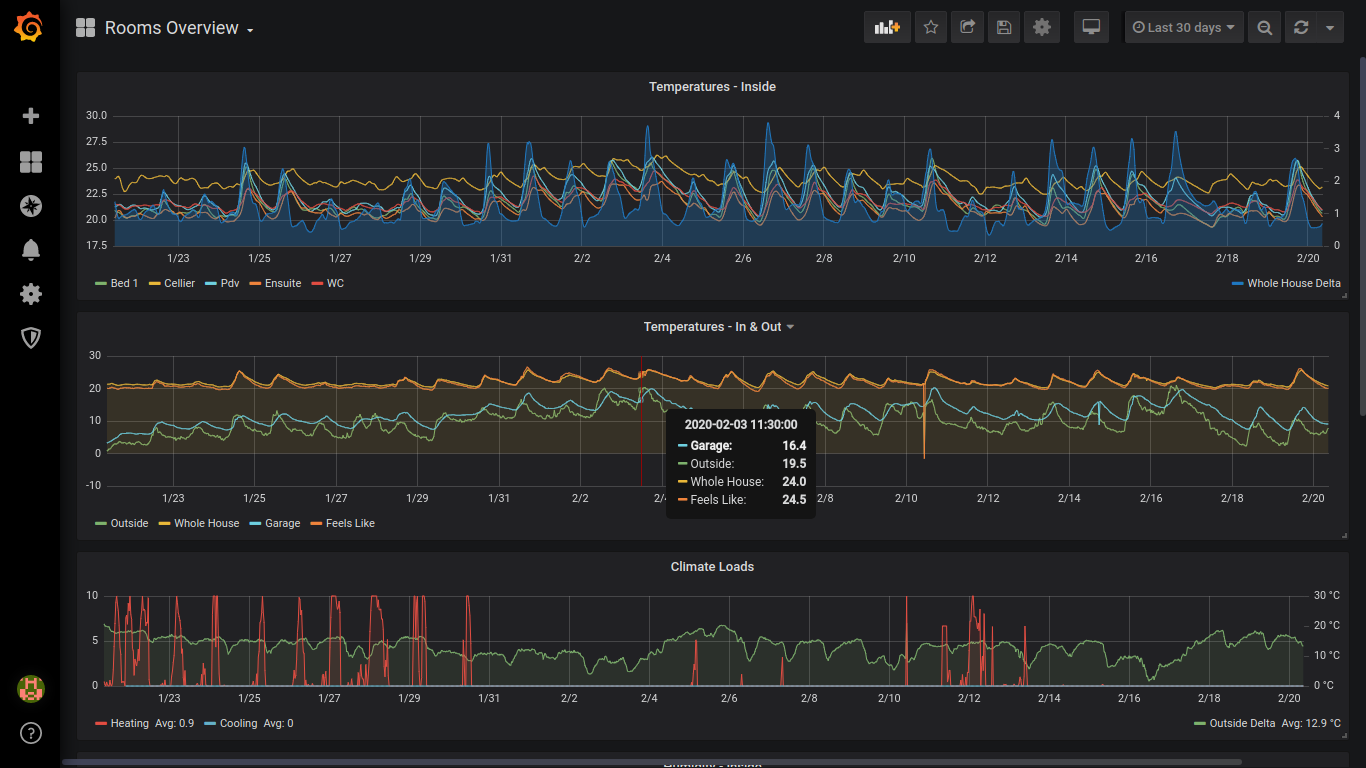
Using these packages it is possible to produce detailed graphs and dashboards, importantly for most, without the use of any scripting. Eg:
Step by Step Instructions
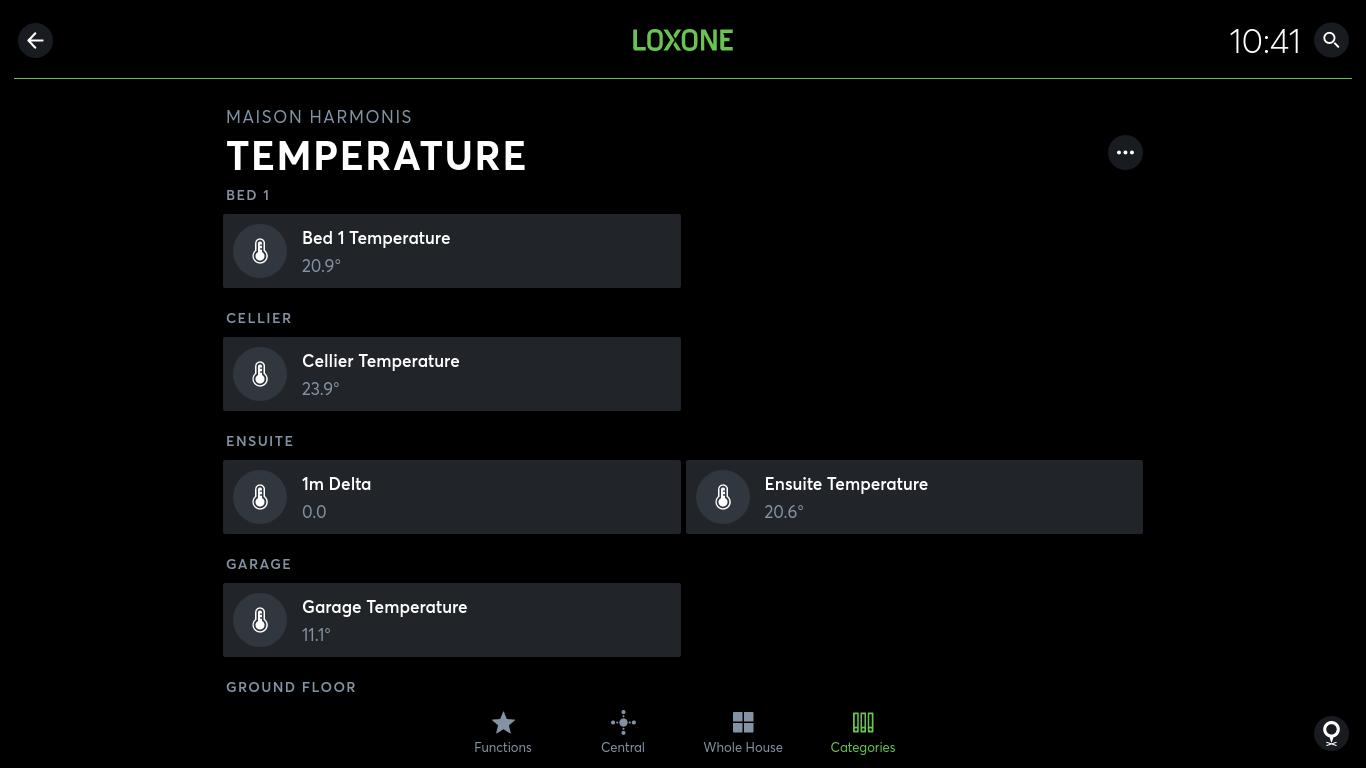
Prepare the Loxone installation to allow viewing of items to graph. These values should be visible in the Loxone web or app interface. It is recommended to create a new user specifically for this task and be sure to only give that user read only access to the item values that are going to be exported to InfluxDB. Login as this user and verify values are visible in the relevant categories. Eg:
 Any object visible to this Loxone user will be automatically imported into ioBroker and it's value kept up to date in real time using a websocket connection to the Miniserver.
- Gather further necessary hardware. A system capable of running all three of the above applications is required with network connectivity to a Loxone Miniserver. Even a Raspberry Pi running Raspbian will has adequate performance. Naturally the more powerful the device the more responsive the system will be in use.
- Download and install the above 3 packages. Follow the instructions for each. The standard installation options for all are recommended.
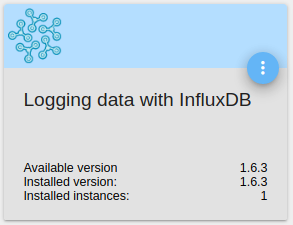
Login to the ioBroker web inferface as admin and iInstall the Loxone adapter and InfluxDB adapter.
In ioBroker, adapter installation is performed by searching for these names in the 'Adapters' tab and hitting the plus sign install links.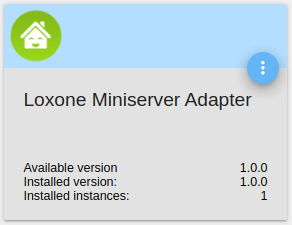
Configure these adapter instances:
In ioBroker, an 'adapter' is a software module that can have many 'instances' created. Configuration of each adapter instance is performed by clicking the 'spanner' icon next to the relevant one in the 'Instances' tab. Adapater instances are also started and stopped from this tab.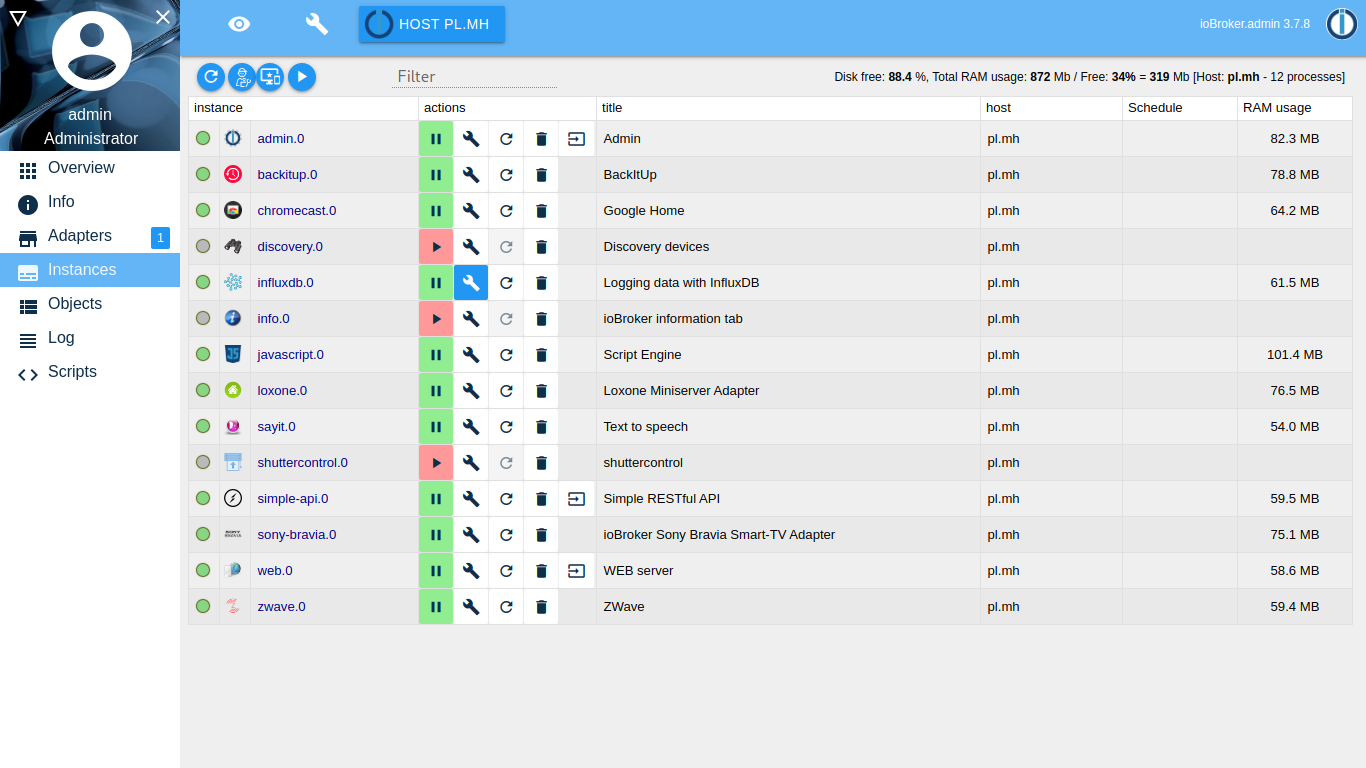
Configure the Loxone adapter with the Miniserver details and user credentials created above.
Configure the InfluxDB adapter with the details of the InfluxDB instance installed (host, user, DB name, etc). Check connectivity with the button at the bottom of the configuration page.
The InfluxDB adapter setup documentation goes into some detail around authentication but for most users on a secure LAN (and even running these applications on the same host) it may be desirable to avoid this complexity.
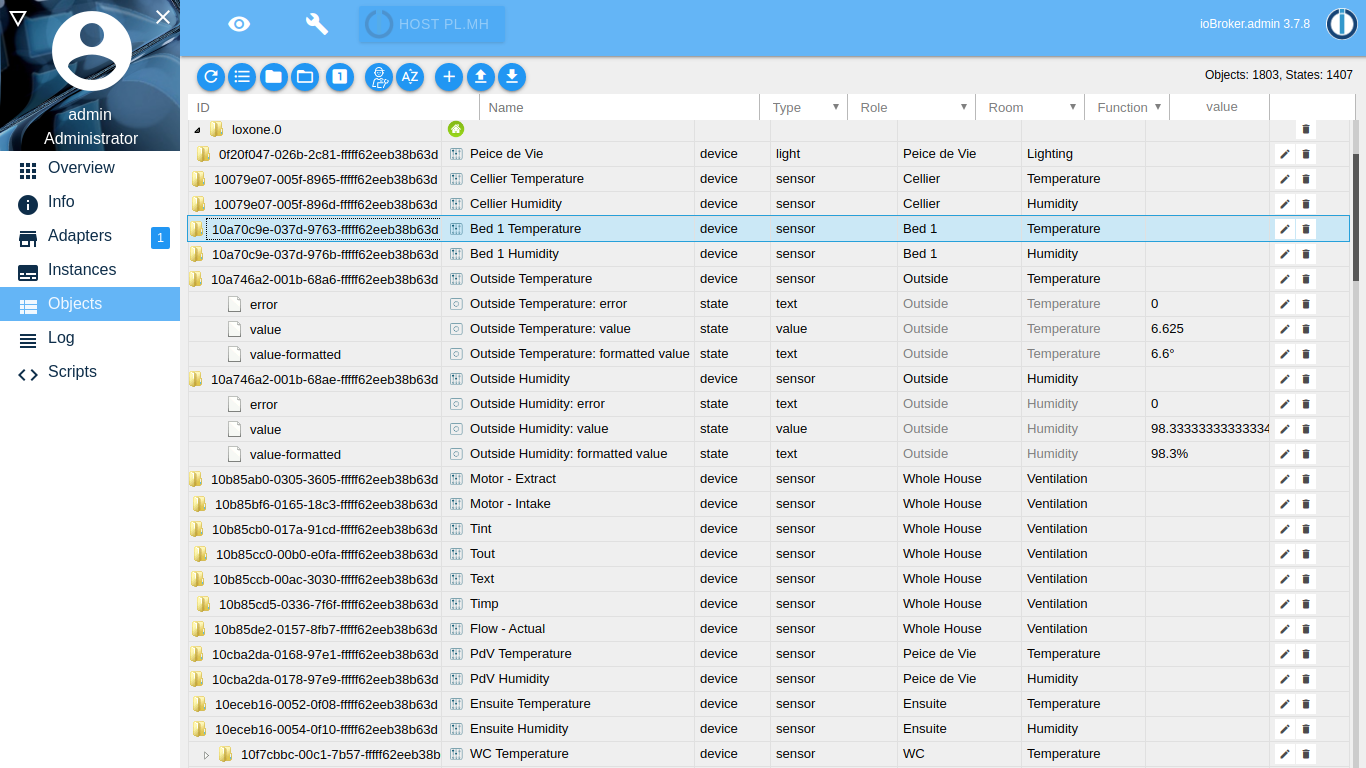
- Start the Loxone adapter instance, at which point it should connect to the Miniserver and populate the ioBroker objects list with all values visible. The values shown on this tab should be seen to be updating in real time as they are read by the relevant sensors in Loxone. Eg:
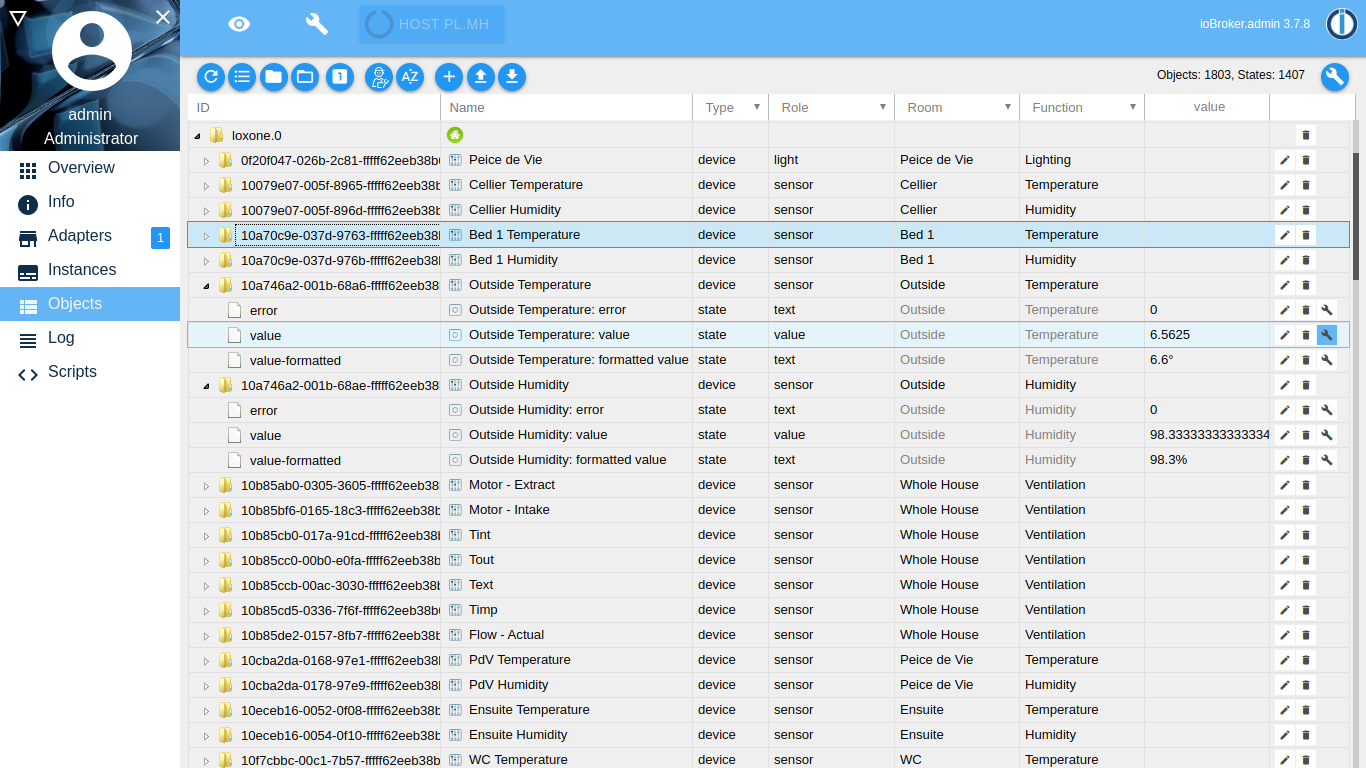
- Start the InfluxDB adapter instance, which should now allow configuration of the InfluxDB settings for each object. Note the icon on the right hand side of each object in the list is now visible:
Configure each value to be stored in InfluxDB by clicking the 'spanner' icon. Check the 'enabled' box.
Once enabled ioBroker will send every change in these values it receives from Loxone to InfluxDB.
ioBroker creates a new InfluxDB 'measurement' for each object. By default the measurement name will be the Loxone UID which is not friendly. Use the 'Alias-ID' value at the bottom of the config screen to give each one a more meaningful measurement name such as 'OutsideTemperature'. Be sure to use an alias that is valid for InfluxDB measurement name.
It is the author's hope that some time in the future these configuration options will be improved to make not only the InfluxDB 'measurement' configurable, but also a number of 'tags' for that system too.
- Login to the Grafana instance to create and configure any dashboards and panels required. #TODO
Running InfluxDB, ioBroker and Grafana with Docker at Loxberry itself
The description above is for a direkt installation of InfluxDB, ioBroker and Grafana at Loxberrys Raspbian.
Here I will describe, how to setup this within Docker at Loxberry, especially Raspberry 4, which seems to be a bit more special than Raspberry 3. In my case, I´m running a Raspberry 4 with 4GB of RAM and Loxberry 2.2.05 (Raspbian 10 Buster) installed. Its running with 32bit (armv7l).
Docker:
First of all, the installation of /wiki/spaces/LOXBERRY/pages/1218019984 is needed. This should work without problems, because Docker natively supports Raspberry 4s hardware platform. For me, I installed "docker-compose" to run this three containers, but working with the by plugin installed "Portainer" has the same results.
Containers:
Under normal circumstances, its not worth to lose a word how to bring up container with docker. But in the special case, to run a InfluxDB container at Raspberry 4, its a bit hard.
InfluxDB:
The actual version 2.x of InfluxDB is just developed as 64bit version. If compiled with 32bit, it wouldn´t run. Also, just a arm64 Docker image is available, which wont run at our Raspberry 4. Pulling a Docker image via "docker pull" will show up the error:
Error: no matching manifest for linux/arm/v7 in the manifest list entries
Trying to switch the Loxberry to 64bit to be able to pull a 64bit version of InfluxDB container is possible by adding "arm_64bit=1" to /boot/config.txt. But with this, a few other topics arent working anymore, e.g. WIFI.
Additionally, this version of arm64 isn´t compatible with InfluxDBs arm64v8, which will cause an error starting the container with message:
exec user process caused 'exec format error'
The only chance to solve this dilemma is, to use InfluxDB v1.8 32bit Docker image. The only problem seems to be, getting an actual compiled version vor arm32v7l. I found "arm32v7/influxdb:1.8" which runs well on my Raspberry 4.
ioBroker:
For ioBroker I used the official container by buanet in version 5: "buanet/iobroker:latest-v5". With the environment key word "PACKAGES" you are able to install additional packages automatically while the container is starting up. See also documentation about possible configuration options: https://hub.docker.com/r/buanet/iobroker
Grafana:
For Grafana, the standard "latest" version is used (actually v7.x).
docker-compose.yml:
This is my docker-compose.yml, which is intentionally written in v2 of Dockers yml style. This should enable, to use this directly with the installed version of Portainer.
version: "2"
services:

influxdb:
image: arm32v7/influxdb:1.8
restart: unless-stopped
ports:
- "8088:8086"
volumes:
- "vol_influxdb:/var/lib/influxdb"
environment:
- "INFLUXDB_DB=smarthome"
- "INFLUXDB_ADMIN_USER=myadmin1"
- "INFLUXDB_ADMIN_PASSWORD=bypassword1"

grafana:
image: grafana/grafana:latest
restart: unless-stopped
ports:
- "8083:3000"
volumes:
- "/srv/iobrokergrafana/grafana.ini:/etc/grafana/grafana.ini"
- "vol_grafana_var:/var/lib/grafana"
- "vol_grafana_etc:/etc/grafana/"
depends_on:
- influxdb
environment:
- "GF_SECURITY_ADMIN_USER=myadmin2"
- "GF_SECURITY_ADMIN_PASSWORD=mypassword2"


iobroker:
image: buanet/iobroker:latest-v5
restart: unless-stopped
ports:
- "8081:8081"
- "8082:8082"
volumes:
- "vol_iobroker:/opt/iobroker"
depends_on:
- influxdb
environment:
- "PACKAGES=iobroker.judoisoft"

volumes:
vol_influxdb:
vol_grafana_var:
vol_grafana_etc:
vol_iobroker:
A good ressource for what is needed for this three containers is https://www.eydam-prototyping.com/2021/01/09/smart-home-zentrale-mit-dem-raspberry-pi/. If you are thinking about backing up the Docker volums, give "duplicati" a try: https://www.himpler.com/blog/smart-home-setup-mit-docker/
In my installations the "/srv" directory is ised to place the configurations.
Hopefully, this short documentation helps you saving the time, I spent with struggeling step by step thru all problems mentioned above.